Graph theoretical analysis is a powerful tool for analysing networks of relationships, be it in biological systems, artificial neural networks, or groups of individuals. They also provide a useful framework for visualising relational information at multiple levels. As a toy example, I have produced a visualisation of rock climbing sequences, or ‘problems’, for my local climbing wall.

Forest fires in Brazil
Following increasing interest in the number of fires in the Amazon rainforest, I decided to dive into the data. This animation shows the month-by-month total of active forest fires from satellite imagery records across Brazil. While 2019 has been a dangerous year due to forest fires, it is not exceptional when compared to historical trends.
I wrote a short article looking at historical trends in forest fires in Brazil, with more visualisations. You can find it on my blog or Medium.
Eurovision

The Eurovision song contest is not only a fixture of the musical calendar, but also a source of rich data on people’s attitudes towards their favourite, and not so favourite, musical performers. This heatmap shows the public votes for the 2019 contestants, broken down by originating country. While they are clear winners (hello Sweden & The Netherlands), we also see geographical and cultural splits that can be mined for insights.
I wrote a short article looking at the discrepancy between public and judge votes in Eurovision data going back to 2014. You can find it here.
Brain cortical thickness

The human brain contains a thin sheet of cells called the cortex, where most neural computations take place. The morphometry of the cortex is of particular interest as a potential marker for functional specialisation in human brain regions and in the development of disease. Here, visual areas of the brain that have similar patterns of cortical thickness cluster together. This clustering aligns with the broad functional organisation of the human visual system, with distinct dorsal and ventral pathways.
The paper is published in NeuroImage, and an interactive model of normative cortical thickness values for human visual areas is available in GitHub.
Volumetric rendering
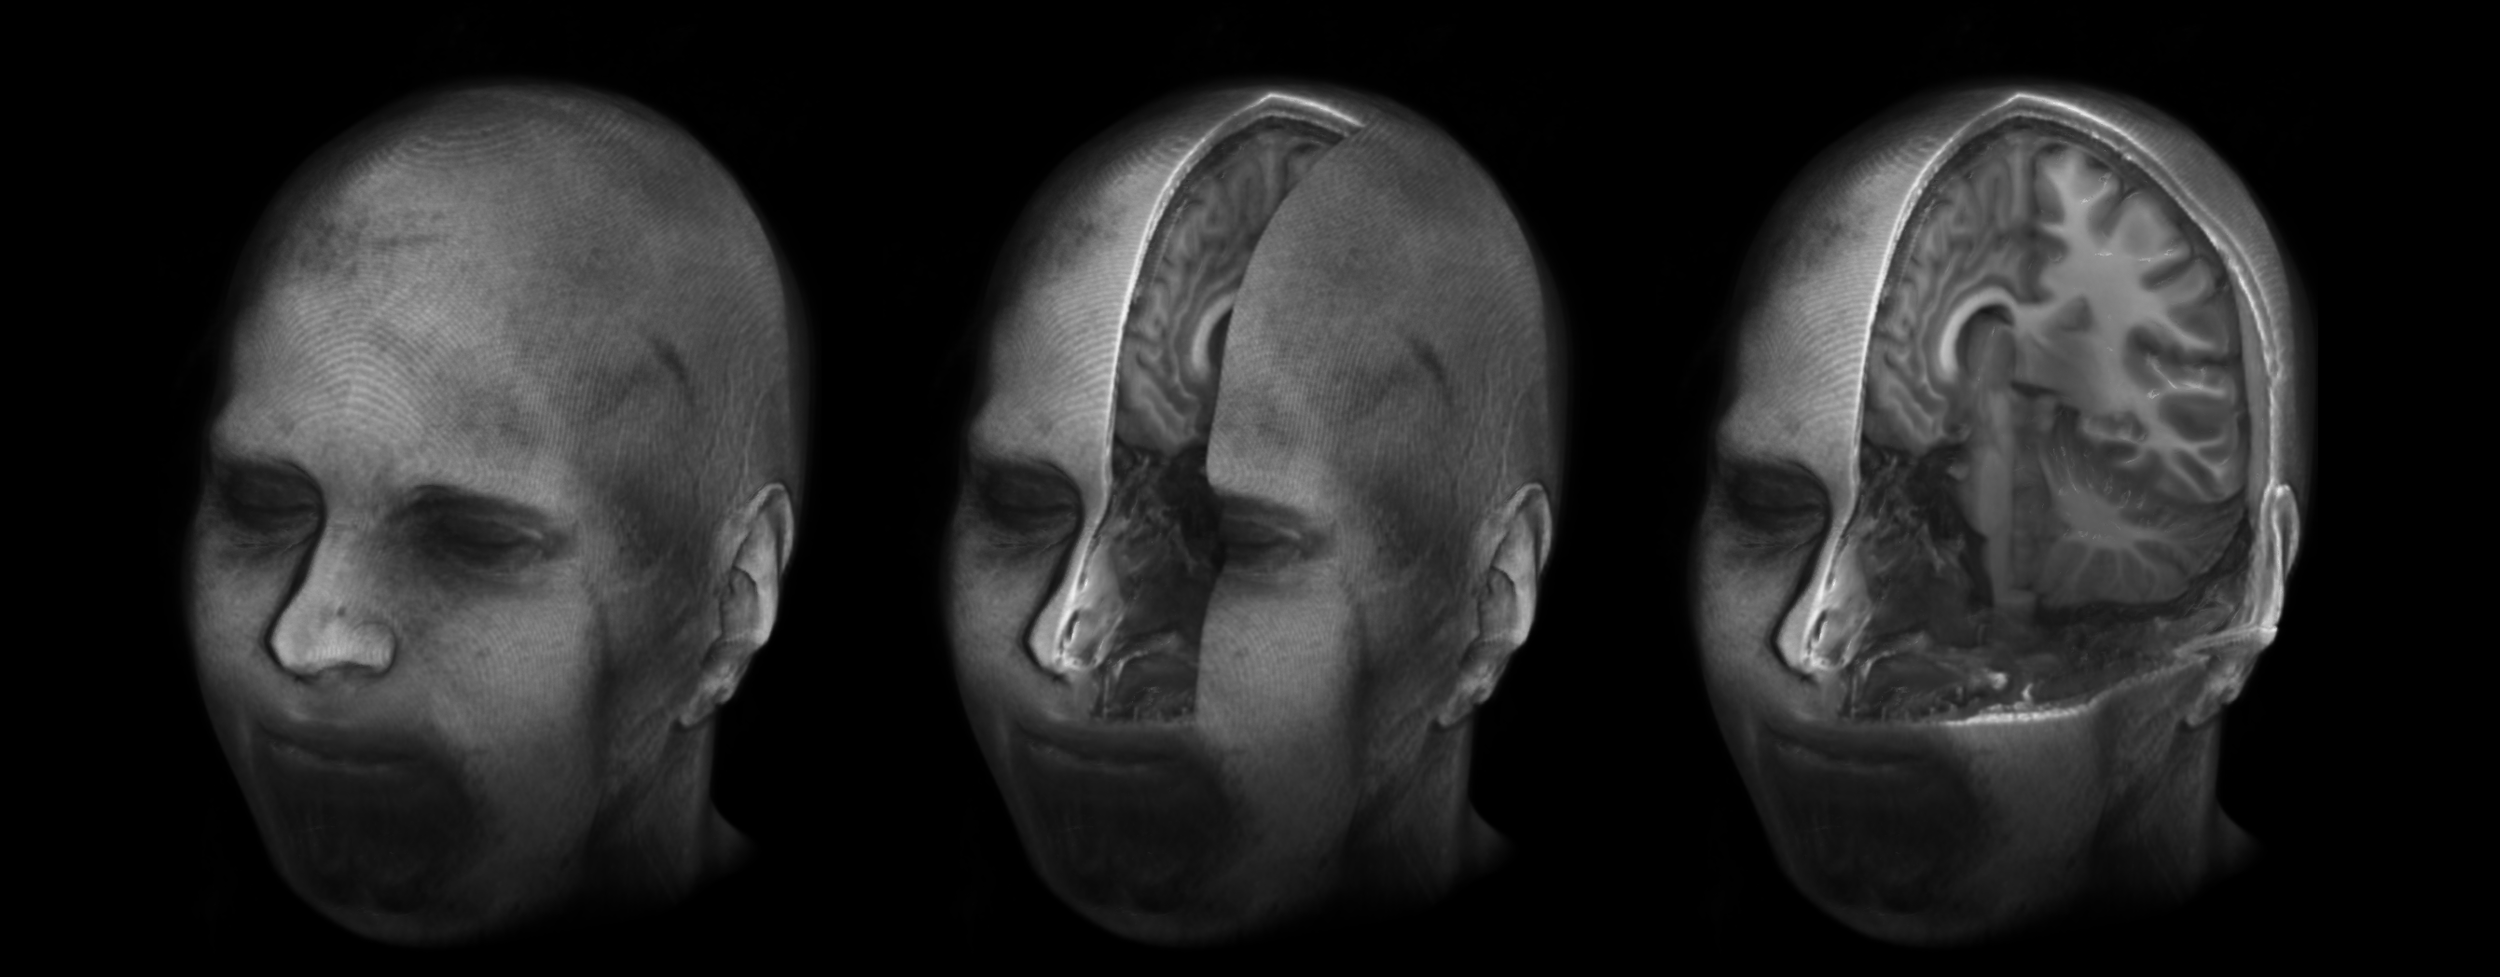
A 3D volumetric surface render from a T1-weighted MRI brain scan. Experimenting with cut-outs and slice options can be a helpful way to illustrate neuroanatomy, particularly in relation to cranial features.
Visualisation made in MRIcroGL.
Track density imaging

Track density imaging (TDI) is a technique in diffusion tractography used to create super-resolved maps of white matter in the brain. The trick in TDI is not to image the white matter directly, but rather to reconstruct the likely paths of white matter fibres from diffusion MRI data, and calculate the relative likelihood of white matter at each super-resolved voxel. I personally like how it makes the brain look like a tangled mess of electrical cabling.
Reconstruction and visualisation made with MRtrix3.