Representative polls of voter intention are our best tool for forecasting how an electorate will vote in a free and fair election. On the 8th of June 2017, the United Kingdom will go to the polls once more to elect members of parliament, with the Conservative party seen as the favourite to win, and the opposition Labour party (as of 3 days before polling day) seen as quickly gaining momentum.
This election is unusual in many ways, but one glaring feature is the widespread distrust of polling forecasts from all sides of the political spectrum. This is unsurprising, given that the majority of polls failed to correctly forecast the 2015 general election or the 2016 referendum on the UK membership of the European Union.
But are polls really that bad? After all, we know voting intention polls are imperfect; they have small sample sizes, may be biased by methodology, experience short-term swings by current events and struggle to reach certain demographics. Pollsters typically claim a margin of error of ±3 percentage points, based on internal validation of their methods. Fortunately we have another way of quantifying just how bad the polls are at forecasting election results – looking at past elections. To assess this, I collected published polls on voting intention for the two major parties (Labour and Conservatives) between the announcement of a general election and polling day going back to 1992. To quantify the error, we can take a snapshot of the polls and compare the forecast against the outcome of the election.
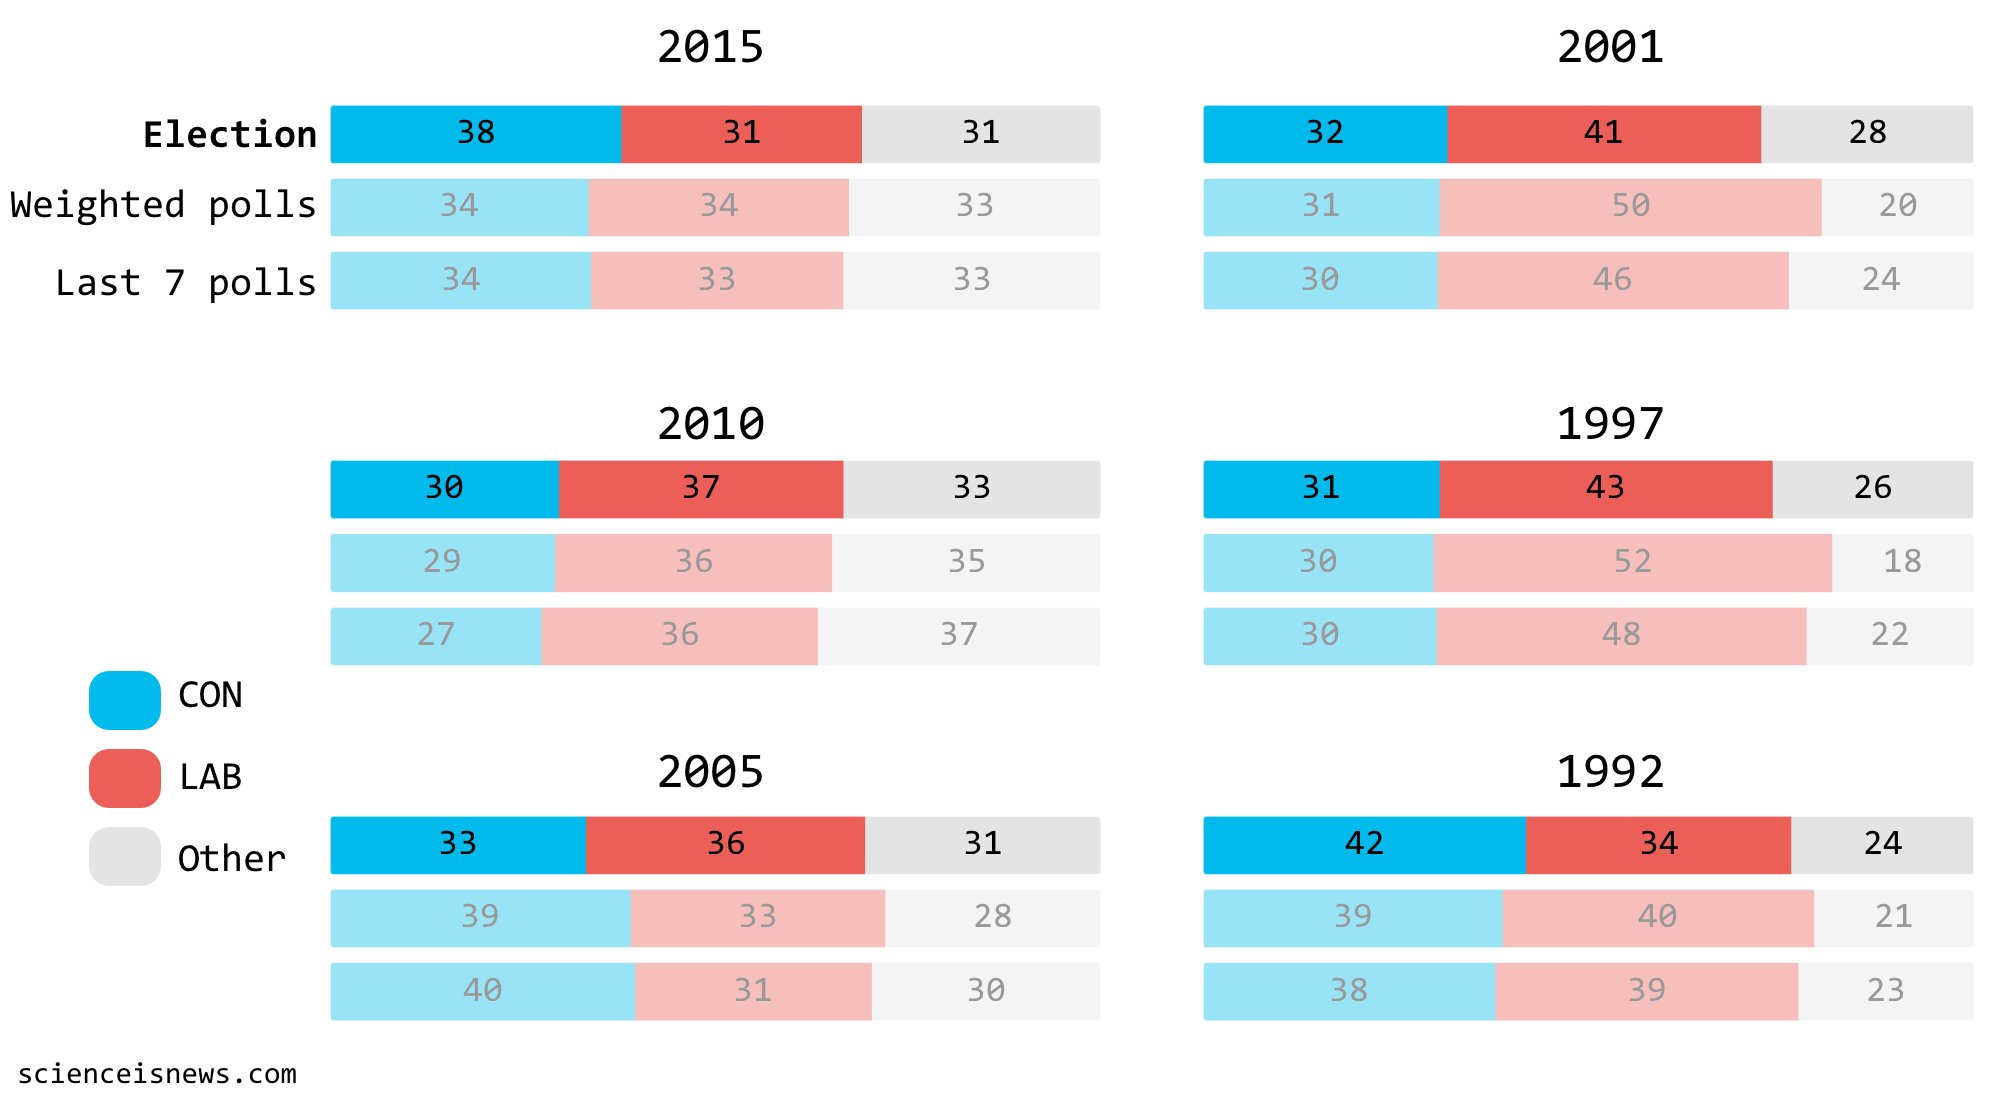
We often look at averages of polls, because any given poll will be subject to noise; either because any given sample will never be perfectly representative or because of biases in the methodology used by the pollster. And because opinion changes with time, we tend to look at the most recent polls. Here we have two alternatives, an average of all the polls conducted during the campaign period, weighted for recency[1], and an average of the last seven poll before polling day, as favoured by UK newspapers.
The mean error between polling averages and election results for this period is between 6 and 7 percentage points, depending on how you average polls. Clearly, this is not a very good forecasting model when elections over this period were decided by an average vote difference of 7 points between the two major parties. In other words, a typical post-1992 UK election is, on average, ‘too close to call’ based on polling forecasts with the error margin being as large as the point difference between the parties.
What does this tell us about the 2017 election? Well, the polls currently stand like this:

With a weighted average of polls since the election was called on 19th April, the Conservatives stand with a more than ample margin of 18 percentage points. However, recent weeks have seen Labour clawing back some territory, with the last seven-poll average putting them 7 points behind the Conservatives. Based on the error rates self-reported by individual pollsters, or long-term projections this places us within safe territory for the Tory party. However, if we wish to take the recent polls and looking at the historical accuracy of poll forecasts taken as a cumulative model, it places us within a possible polling error upset.

Taking the 60-odd polls conducted in the last month, we can model voter preference for the Labour or Conservative party as a normal distribution, which approximates the data fairly well[2]. We can then ask what is the probability that a larger share of the electorate votes for the underdog than for the favourite, i.e. a forecast upset. For the model derived exclusively from 2017 polling data, we can expect a 5% chance of an upset, which places the Conservatives in a secure place. However, the polling error rate is not well reflected in the internal variance of the polling sample, so we can adjust the error rate by the expected range seen in the historical data, i.e. ±7 percentage points. This simulation gives us a probability of a forecast upset of 11%, or to put it another way, if pollsters are making the same errors since 1992, there is a 11% chance they have wrongly forecast the Conservative party as securing more votes than the Labour party on the 8th June.
However, it should be noted this is not the whole story. UK general elections are not decided by a single party capturing the plurality votes, but by forming a majority in Westminster through a byzantine system of local seat elections. The First Pass The Post system results in a winner-take-all outcome for individual constituencies. If one candidate secures more votes than any single other candidate, they can, and often do, win the constituency with less than 50% of votes, meaning a majority of votes in that constituency did not contribute to the overall outcome of the election. Much has been written about First Pass The Post, but suffice to say for our discussion that this system makes translating voter intention polls to parliamentary seats a notoriously tricky problem. Second, UK governments can be formed by political coalitions when one party does not hold absolute majority in the House of Commons, as happened in 2010 when a Conservative and Liberal Democrat coalition assumed power. In this scenario it is not the overall majority of parliamentary seats that matter, but the proportion of seats controlled by each party. Both of these complications mean a forecast purely based on the share of the vote captured by each party is an insufficient model of the UK general election, and with a large error rate based on historical performance to boot.
What should we make of this? As it stands, the Conservatives retain a comfortable lead, but the error margin is much larger than you might guess by looking at 2017 polls alone. While it might be tempting to keep checking the worm of public opinion swing up and down on daily poll trackers, remember to take it with a pinch of salt.
—————————————————————————————————
[1] Polls are weighted with an exponential function, giving larger weights to polls conducted closer to polling day. For the simple seven-poll average, no weighting was applied.
[2] The Gaussian model explains >99% of the data (R2 = 0.9994). This model includes all publicly available polls carried out between the day the election was called (19th April 2017) and the time of writing (5th June 2017). The model does not weight samples by recency, nor by accuracy of the pollsters, both of which would be sensible additions for future models.
Polling data were obtained from UK Polling Report and Opinion Bee. There is a never-ending stream of UK election poll trackers, but I recommend checking out the Financial Times, Economist or Guardian for their sound methodology and excellent visualisations.